This email address is being protected from spambots. You need JavaScript enabled to view it.

Select your language

Select your language

Imagine the possibilities..


Song-Credits:
"What a Wonderful World," performed by 2WEI,
Ali Christenhusz, and Edda Hayes.

Services

We offer a wide range of GIS services for organizations working with spatial and demographic data. From analysis and automation to visualization and web integration: we make data clear, reliable, and actionable.


GIS Analysis & Spatial Insight

We support the analysis and interpretation of spatial data to clarify complex issues. Smart GIS analyses provide insights that help with informed decisions and more efficient processes.

Applications include:

  • Spatial analyses and modeling
  • Network and accessibility analyses
  • Scenario and impact analyses
  • Support for policy and planning issues

Demographic Analyses

Demographic data often forms a crucial layer within spatial challenges. We help analyze, combine, and visualize demographic data in its geographic context.

Examples:

  • Population structure and development
  • Segmentation and target group analyses
  • Combining demographics with infrastructure, networks, or facilities
  • Support for location choices and strategic planning

Automation

Workflow

Your complex workflow can be implemented in a user-friendly tool.

Automation & Data Integration

We develop automated GIS solutions that reduce manual work and make processes reproducible. We also ensure robust connections between different data sources.

Think of:

  • GIS workflows and model automation
  • Links to databases, Excel files, and external sources
  • Processing large and incomplete datasets
  • Consistent and repeatable analyses

Visualization & Geographic Animations

Clear visualizations make complex data understandable. We design maps, dashboards, and geographic animations that bring data to life and make it accessible to a wide audience.

Possibilities:

  • Custom map visualizations
  • Geographic animations (e.g., time series or scenarios)
  • Presentation maps and reporting visuals
  • Support for communication and decision-making

Our first layer is still the foundation of quality!

Pancake

Just like stacking these five perfect pancakes, we ensure excellence from start to finish.

Web Maps & Website Integration

We seamlessly integrate interactive maps and spatial data into websites and web applications — for both new websites and existing platforms.

We can assist with:

  • Integration of interactive maps on websites
  • Implementation of map data in an existing website
  • Renewal or redesign of an existing website, including map functionality
  • Advice on usability and performance
    We can also provide hosting and domain registration so everything is managed under one roof.

GeoServer & GIS Infrastructure

For organizations that want to manage and publish their own data, we set up tailored GIS infrastructure.

Including:

  • Setting up and configuring GeoServer environments
  • Publishing map layers and services
  • Support for GIS data management and structure
  • Advice on scalability and future-proofing

Collaboration & Approach

We work as a compact and flexible team and switch quickly. Whether it’s a defined issue or long-term support: we think along, work pragmatically, and deliver solutions that keep working in practice.


Want to know more?
  →   Contact us

For an introduction:
  →  Schedule an appointment

Scope of Work

Our scope is comprehensive — and we don’t just say that for search engines. Anything with a “where?” can be mapped. Even things without a physical location (like networks or influence) can be represented cartographically. Challenge us to find a use case we can’t solve:

Read more...


Examples include:

  • Basics & Orientation: Topographic maps | World, country, and regional maps | City maps | Elevation maps (relief, DEM, contour lines) | Satellite and aerial imagery | Navigation maps (car, bike, pedestrian, sea, aviation)
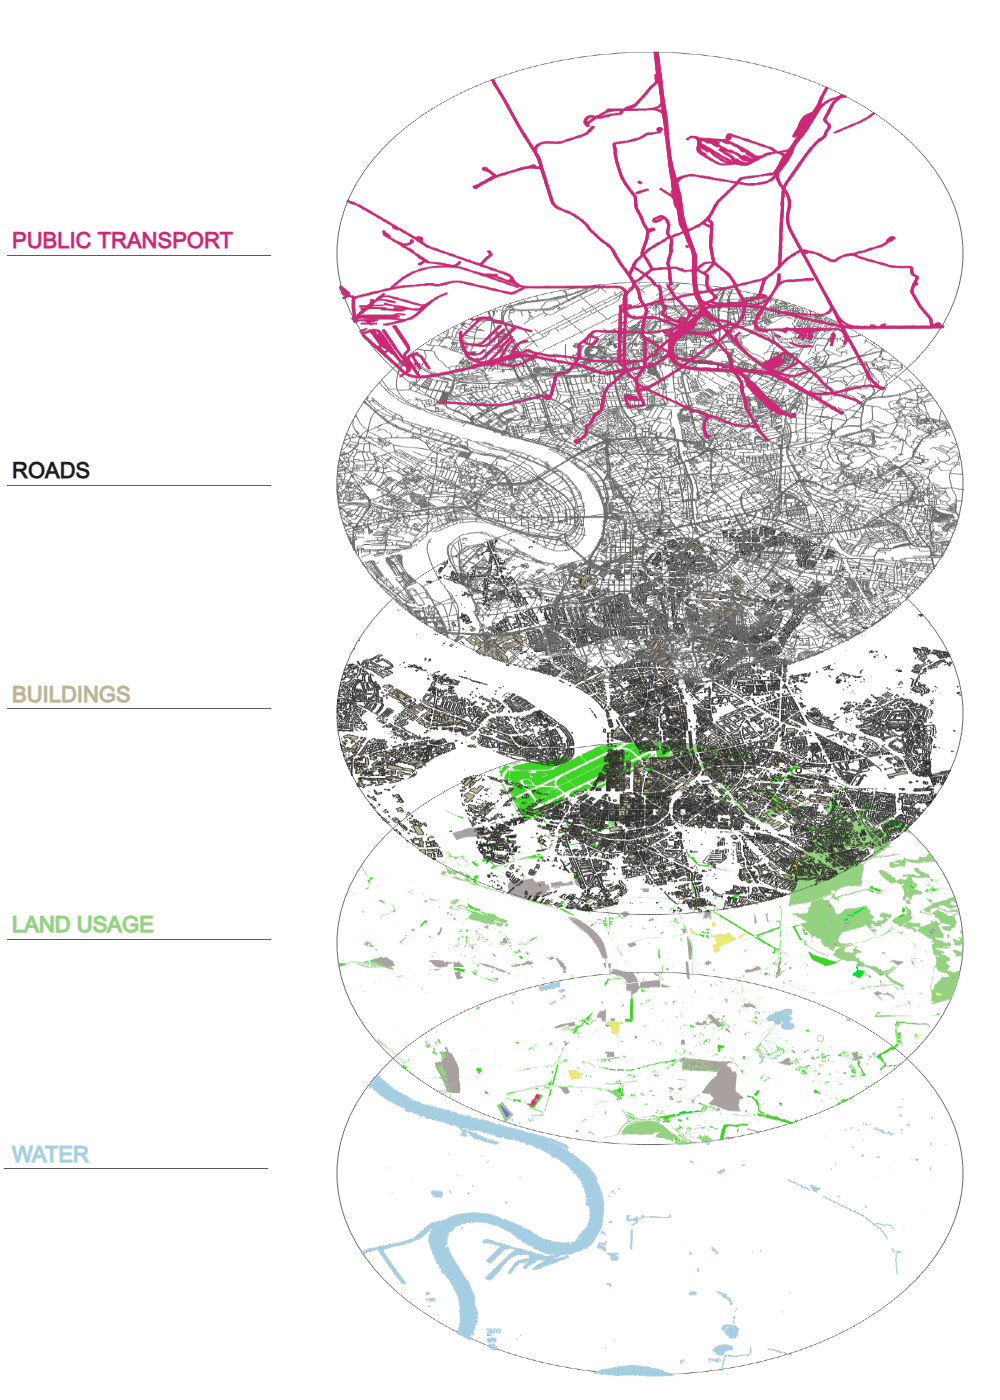
  • Transport & Mobility: Road networks | Railways | Public transport lines and stops | Air corridors | Shipping routes | Cycling and hiking trails | Traffic density & travel time | Accident maps | EV charging points | Parking pressure | Logistics corridors | Last-mile delivery maps
  • Logistics & Supply Chain: Distribution centers & hubs | Warehouse locations | Delivery zones | Route optimization | Cold-chain monitoring | Inventory distribution | Customs and trade routes | Port and terminal maps | Risk and delay analysis
  • Demographics & Society: Population density | Age structure | Migration flows | Household composition | Income & socioeconomic status | Employment | Education level | Health indicators | Voting behavior & election results | Crime | Social services | Aging & shrinking regions
  • Meteorology & Climate: Weather maps (temperature, precipitation, wind) | Pressure systems | Climate zones | Heat islands | Drought indices | Rainfall runoff | Flood risk | Sea level rise | Climate scenarios | Storm and hurricane maps | Air quality
  • Environment & Nature: Soil types | Vegetation & land use | Biodiversity | Natura 2000 areas | Ecological corridors | Water quality | Noise pollution | Light pollution | Nitrogen deposition | CO₂ emissions | Waste streams | Environmental risks
  • Spatial Planning & Real Estate: Zoning plans | Environmental plans | Building heights | Property values | Vacancy | Development sites | Infrastructure plans | Urban densification | Heritage and monuments
  • Agriculture & Food: Parcel maps | Crop monitoring | Soil fertility | Irrigation | Precision farming | Harvest forecasts | Land use history | Food chains | Livestock distribution
  • Industry & Energy: Energy infrastructure (gas, electricity, heat) | Wind and solar farms | Grid capacity | Mining | Raw materials | Industrial clusters | Risk contours (BRZO) | CO₂ storage | District heating networks
  • Health & Care: Hospital accessibility | GP posts | Ambulance response times | Disease spread | Epidemiology | Health disparities | Aging pressure | Care capacity | Environmental health
  • Safety & Crisis Management: Disaster plans | Evacuation maps | Flood scenarios | Fire risk | Police and fire zones | Critical infrastructure | Cyber-physical risks | War and conflict maps | Emergency coordination
  • Governance, Policy & Law: Municipal and provincial boundaries | Jurisdictions | Electoral districts | Policy impact maps | Subsidy areas | Land ownership | Cadastre | Legal zones
  • Education & Research: Research data visualization | Historical maps | Archaeological sites | Scientific models | Student reach | Campus development
  • History & Culture: Historic cities | Old trade routes | Battlefields | Cultural heritage | Language distribution | Religious geography | Migration through the ages
  • Media, Communication & Storytelling: Infographics | Journalistic maps | Story maps | Interactive web maps | Data journalism | Timelines on maps | Visualizations for policy and public
  • Technology & Innovation: Smart cities | IoT sensor locations | Digital twins | AR/VR maps | Navigation for robots & drones | Game maps | Simulations | AI training datasets
  • Tourism & Recreation: Points of interest | Routes & trails | Nature areas | Recreation pressure | Hotels & hospitality | Event maps | Cultural tourism
  • Abstract & Non-Physical Applications: Network diagrams (as maps) | Mind maps with spatial logic | Conceptual maps | Process maps | Relationship and influence spheres | Market areas | Accessibility in time instead of distance